Paper Reading: ARGUS — Always-On Tracing at 10,000+ GPU Scale
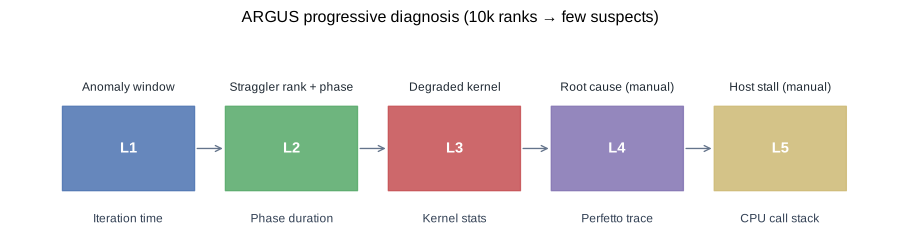
Paper Reading: ARGUS — Always-On Tracing at 10,000+ GPU Scale What Tencent built to catch fail-slow training jobs on 10k+ GPU clusters with under 2% overhead — plus Modal remasurements of CUPTI Activity API / torch.profiler / nsys overhead, case-study reproductions, and the KDE + W₁ detection path. Paper: ARGUS: Production-Scale Tracing and Performance Diagnosis for over 10,000-GPU Clusters (Zhou et al., Tencent, arXiv 2606.20374, submitted to ATC 2026) TL;DR Large LLM training jobs are synchronous: one slow rank, link, or host-side stall can waste thousands of GPU-hours without triggering a hard failure. Existing tools split into two camps: ...