torch.compile: The Mental Model That Actually Matters
Most writeups of torch.compile are either a flag cheat-sheet or a file-by-file museum tour. Neither helps when a training step is only 1.2× faster and you do not know whether to blame graph breaks, recompiles, or Inductor.
The useful model is simpler: compile is specialization under recorded assumptions. Dynamo captures a region, Inductor emits kernels tuned to that region, and guards decide whether the specialization still applies. Everything else — FX, AOTAutograd, Triton — is machinery in service of that contract.
TL;DR
torch.compile(...)mostly installs a CPython frame hook. Compilation happens on the first real call.- Speedups come from fewer launches + less HBM traffic, not from inventing FLOPs. Graph breaks and weak fusion kill the bargain.
- Guards are the product. Cache hits are cheap; guard failures are a new specialization (or eager fallback).
dynamic=Truewidens one guard set. Multiple specializations come from multiple compiles, chained as an LRU.- Debug in order: breaks → recompiles → fusion/launch gaps → mode. Do not open Nsight first.
- Failure-mode lab (graph breaks, shape thrash, scalar guards):
playground/torch_compile_failure_modes.py. Toy capture→guard→cache:playground/torch_compile_mini.py. Figures:playground/torch_compile_figures.py.
The Compile Bargain
Eager PyTorch won because the programming model is honest: Python runs, ops dispatch, you can print and breakpoint anywhere. That honesty costs you. A transformer block becomes hundreds of tiny kernels. The GPU spends time waiting on launches and round-tripping epilogue tensors through HBM.
torch.compile keeps the programming model and tries to recover the performance of a static graph system only where it is safe. The bargain is:
Specialize what you can prove. Leave the rest eager. Reuse the specialization while the proof still holds.
If you remember one picture, make it this:
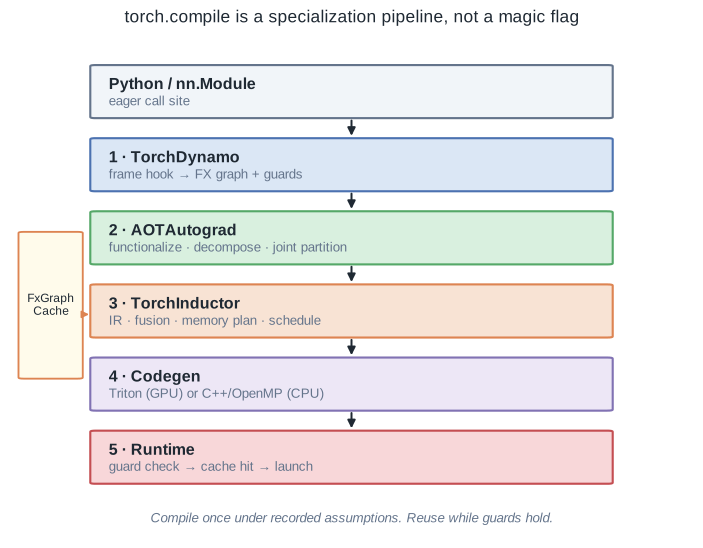
Five layers, one job each:
| Layer | Job | Failure mode you will actually see |
|---|---|---|
| Dynamo | Capture tensor regions from Python bytecode | Graph breaks → eager islands |
| AOTAutograd | Functionalize, decompose, joint fwd/bwd partition | Bad save/recompute → memory or recompute spikes |
| Inductor | Fuse, schedule, plan buffers | Weak fusion → many aten:: kernels |
| Codegen | Triton / C++ | Bad autotune / first-run compile cost |
| Runtime | Guard → cache → launch | Recompile thrash |
Knobs you will actually touch:
| Parameter | What it really changes |
|---|---|
fullgraph=True | Turn silent breaks into hard errors — a debugging tool |
dynamic=True | Wider guards, fewer recompiles, less aggressive kernels |
mode="reduce-overhead" | CUDA Graphs for launch-bound small batches |
mode="max-autotune" | Pay warmup to search configs — serving, not every train step |
Dynamo: Capture Is a Frame Hook
Dynamo does not sit next to the interpreter. It sits under it. Via PEP 523, set_eval_frame replaces CPython’s frame evaluation function. After that, every Python call can be intercepted before bytecode runs.
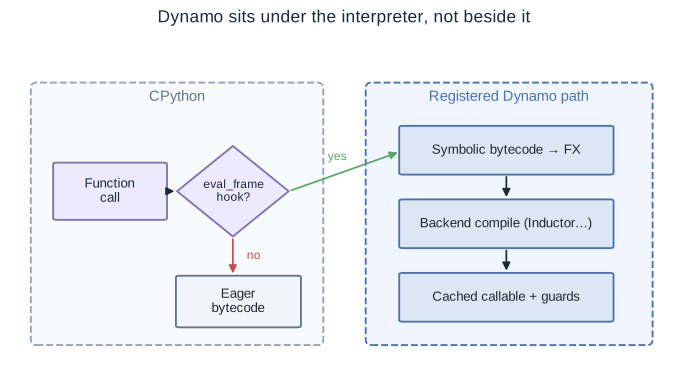
That design choice is why torch.compile can accept ordinary Python and still refuse to compile print, generators, or data-dependent control flow: the tracer walks bytecode symbolically, records tensor ops into an FX graph, and graph-breaks when it cannot continue. Broken regions stay eager. The compiled pieces become separate specializations.
Fast filters keep the JIT from eating itself: no tensors in the frame → skip; print/logger/generators/nn.Module internals → skip; cache size limit → stop specializing a hot frame; re-entrancy guards → never compile the compiler.
The source of truth for this layer is torch/_dynamo/eval_frame.py and convert_frame.py. You rarely need to read them. You need to understand that capture is opportunistic, not whole-program.
Guards: The Product Is the Assumption Set
An FX graph is not “the model.” It is “the model under these assumptions.” Dynamo records those assumptions as guards — shapes, dtypes, devices, requires_grad, scalars that affected branches, sometimes object identity.
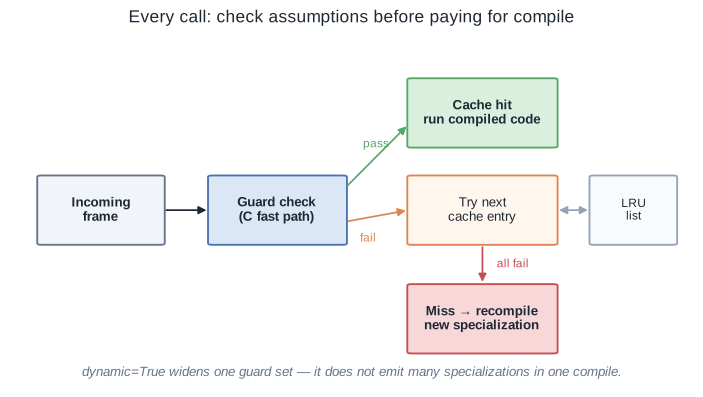
Runtime order on every call:
- Run the C-side guard check.
- First matching cache entry → execute compiled code.
- All entries fail → recompile a new specialization (or fall back).
Three misconceptions burn people:
dynamic=Trueis not “compile once for all shapes.” It emits one looser guard set. Many shapes still mean many compiles if you stay static — or one dynamic compile if the symbolic constraints cover them.- Python scalars are specialized. Optimizer
lr = 0.01as afloatwill recompile when the schedule changes. Put values you intend to mutate into tensors if they sit inside compiled regions. - Object-identity guards (
ID_MATCH) fire when you rebuild modules, closures, or containers every step. That looks like “compile is flaky.” It is Dynamo being correct.
| |
If you see the same frame recompile every few steps, you do not have a kernel problem. You have a specialization thrash problem.
Graph Breaks Destroy the Bargain
Fusion and CUDA Graphs assume a contiguous compiled region. A graph break inserts an eager island: Python runs again, tensors cross the boundary, and Inductor cannot fuse across the cut.
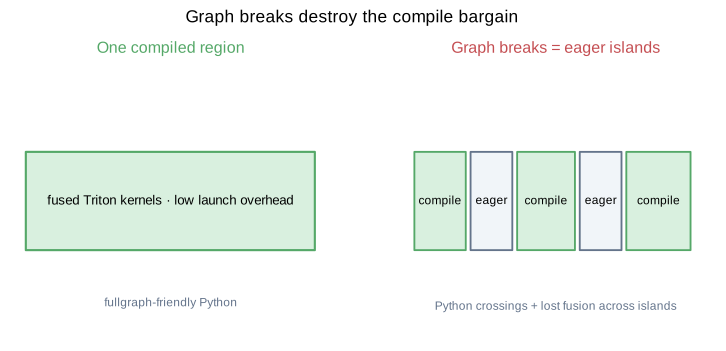
Common break causes, in the order I see them:
print/ logging of tensor values- Python
ifon a tensor-derived scalar - accidental NumPy / Python list work in the hot path
- data-dependent ops (
nonzero, boolean indexing patterns Dynamo cannot symbolize)
Debugging move:
If fullgraph=True is impossible for the whole module, compile the hot submodule. Partial compile of a clean region beats whole-model compile of a broken one.
AOTAutograd: Training Needs a Joint World
For inference, Dynamo → Inductor is enough. For training, AOTAutograd rewrites the graph before Inductor sees it:
- Functionalize in-place / view ops so reordering is safe.
- Decompose high-level ATen into primitives (
layer_norm→ mean/var/… ) so fusion can see the epilogue. - Joint forward+backward, then min-cut partition to choose save vs recompute.
The joint graph is the point. Only then can the partitioner ask globally: is this activation cheaper to store or to rematerialize in backward?
AOTAutograd optimizes the compile-time world. If your real run keeps changing shapes or control flow, the partition you paid for may not match the run you get. That is another reason recompile metrics matter.
Inductor: Fusion Is a Bandwidth Decision
Inductor lowers FX into its own IR (pointwise, reduction, extern/GEMM), schedules fusion, plans buffers, and emits Triton on GPU (or C++/OpenMP on CPU).
The fusion scheduler is not mysticism. It scores candidates by shared memory traffic, checks legality (devices, deps, cycles, index match), and often benchmarks fused vs unfused before accepting. Names like triton_poi_fused_* in a profiler are the receipt.
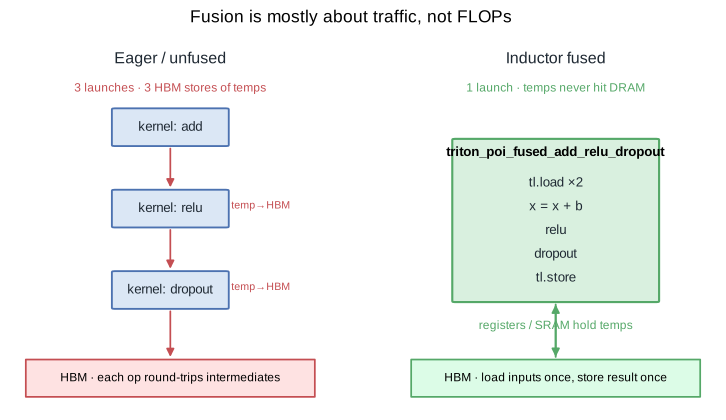
Three launches become one. Temps stay in registers. That is the entire economic argument for compile on memory-bound epilogues.
GEMMs still go through extern kernels (cuBLAS / vendor libs). Compile shines on the glue around them — and on making sure that glue does not become the critical path.
What To Look at When It Is Slow
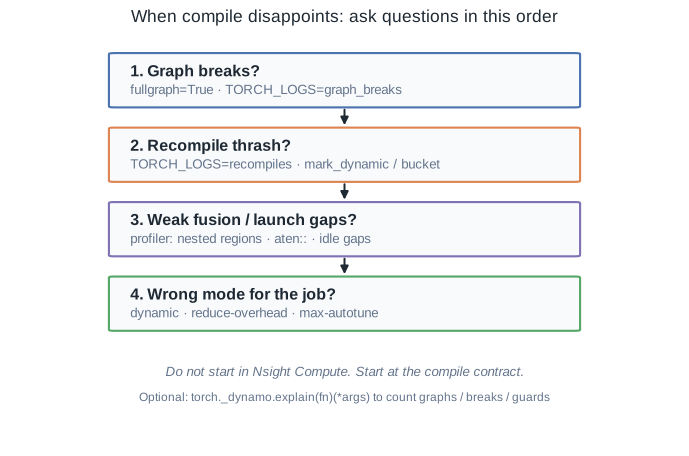
1. Graph breaks. Nested “Torch-Compiled Region” events, or fullgraph=True failures.
2. Recompiles. TORCH_LOGS=recompiles. Fix shapes with bucketing / mark_dynamic, fix scalar/ID thrash, move data-dependent branches out.
3. Fusion and launches. Profiler: mostly triton_* is healthy; dense aten:: and wide idle gaps are not. Small-batch inference often wants mode="reduce-overhead".
4. Mode / dynamic tradeoffs. Static specialization is faster when shapes are stable. Dynamic is correct when they are not. max-autotune is a serving tax, not free training speed.
Useful companion tools:
Observability reference: PyTorch compile programming model.
Failure Modes Lab
Abstract advice is cheap. playground/torch_compile_failure_modes.py reproduces four failure modes on CPU with backend="eager" / CompileCounter — no GPU required:
| |
What you should see on a current PyTorch (measured here on 2.12):
1. Data-dependent Python if. if x.sum().item() > 0 → explain reports 2 graphs / 1 break; fullgraph=True errors. torch.where(...) → 1 graph / 0 breaks and passes fullgraph=True.
2. print in the hot path. Without fullgraph, the call still “works” — Dynamo breaks, runs the side effect eager, continues. With fullgraph=True, it fails loudly. Silent success is why breaks are easy to miss.
3. Shape thrash. With automatic_dynamic_shapes=False, shapes 32 → 64 → 128 cost 3 compiles. Default automatic-dynamic recompiles once then widens (32 → 64 → 128 → 2 compiles). dynamic=True stays at 1. Automatic dynamic helps; it is not a substitute for intentional bucketing / mark_dynamic in production shape noise.
4. Python scalar guards. fn(x, lr=0.01) then lr=0.02 → recompile. The same values as torch.tensor → one compile. Optimizers that mutate a Python float inside a compiled region pay this tax every schedule step.
These four cover most “compile did nothing / got slower” reports I see. Fusion quality still needs a profiler; capture and specialization do not.
Custom Backends (Only If You Need Them)
A backend is a function from FX graph → callable:
This is how you separate “Dynamo cannot capture” from “Inductor generated a bad kernel.” Most performance work never needs a custom backend. Capture debugging does.
A Minimal Contract in Code
The real stack is large. The contract fits on a napkin: capture → compile → guard → reuse or recompile. playground/torch_compile_mini.py implements that loop for relu(x + y) without Dynamo:
| |
Use the failure-mode lab above for real torch.compile behavior; use the mini demo to internalize the cache/guard contract.
Closing
torch.compile is not a turbo button. It is a selective specializing JIT with an explicit fallback to Eager.
- Dynamo decides what can be specialized.
- Guards decide when a specialization is still valid.
- Inductor decides how to turn a region into fewer, fatter kernels.
- You decide whether your Python is honest enough for that pipeline to fire.
When the speedup is disappointing, the question is almost never “which Triton flag.” It is “which part of the specialization contract broke first.”