Paper Reading: ARGUS — Always-On Tracing at 10,000+ GPU Scale
What Tencent built to catch fail-slow training jobs on 10k+ GPU clusters with under 2% overhead — plus Modal remasurements of CUPTI Activity API / torch.profiler / nsys overhead, case-study reproductions, and the KDE + W₁ detection path.
Paper: ARGUS: Production-Scale Tracing and Performance Diagnosis for over 10,000-GPU Clusters (Zhou et al., Tencent, arXiv 2606.20374, submitted to ATC 2026)
TL;DR
Large LLM training jobs are synchronous: one slow rank, link, or host-side stall can waste thousands of GPU-hours without triggering a hard failure. Existing tools split into two camps:
- Always-on, coarse monitors — cheap continuous checks on iteration time, heartbeats, or link/machine health. Good at “something is wrong on node X,” weak at “which kernel and why.”
- Fine-grained profilers —
torch.profiler, Nsight Systems, and research tracers that can name kernels, but typically cost 5–30%+ overhead and emit trace volumes that cannot stay always-on at 10k GPUs.
(The ARGUS paper’s Table 1 puts recent cluster systems into these two buckets: Greyhound / Holmes / C4 / Minder on the coarse always-on side; MegaScale / EROICA / FLARE on the finer but harder-to-keep-on side. See References.)
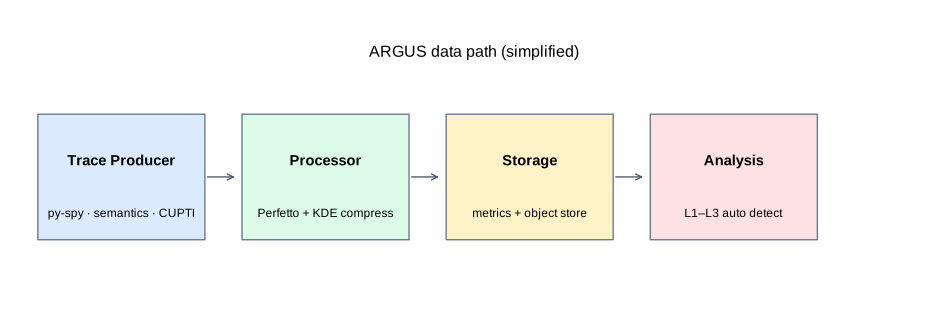
ARGUS tries to occupy the missing middle: fine-grained, always-on, real-time diagnosis at production scale. The recipe:
- Split observation by training hierarchy — CPU stacks (py-spy), framework semantics (CUDA Events on phases), GPU kernels (CUPTI Activity API).
- Tier the data — hot metrics to Prometheus/Grafana; full Perfetto traces to object storage; kernel events compressed online by ~3,700× via KDE clustering.
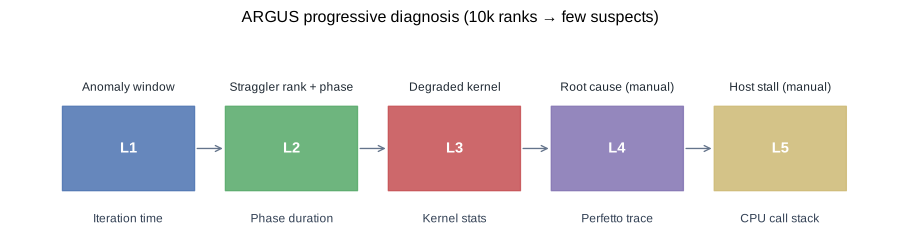
- Diagnose progressively — L1 iteration spikes → L2 straggler rank + phase → L3 degraded kernel → L4/L5 manual Perfetto + CPU stacks.
Deployed on a 10,000+ GPU production cluster for six months; combined overhead < 2%. The paper’s five case studies are the best part: they show failures that coarse monitoring misses and profilers cannot keep running.
Why This Paper Matters
If you have read Profiling a PyTorch Training Job End to End, you already know the local workflow: classify the bottleneck, then zoom in with the right tool. ARGUS is the production-scale answer to a harder question:
How do you run that workflow continuously on every rank of a 10k-GPU job, without paying 20% training tax or drowning in trace data?
The motivating number from the paper is stark: in one 4096-GPU job, iteration-time spikes above 2× baseline wasted roughly 23,758 GPU-hours (~7% of total compute). Fail-slow is not rare noise; at scale it is a tax on every long run.
The design tension is familiar:
| Requirement | Why it is hard |
|---|---|
| Low overhead | GPU time is expensive; profilers perturb behavior (observer effect) |
| Fine granularity | Need kernel-level truth, not just “rank 42 is slow” |
| Always-on | Fail-slow is intermittent; triggered profiling misses windows |
| Real-time | Waiting hours for offline analysis wastes more compute |
| Cross-rank | 10k ranks × 10⁴–10⁵ kernel events/min → hundreds of GB/min raw |
ARGUS does not pick one sacrifice. It decomposes the problem.
System Overview
Three observation channels (§4)
Modern training spans three layers (Figure 2 in the paper):
- Python / host — scheduling, dataloader, GC, GIL.
- Framework semantics — forward, backward, optimizer, NCCL collectives as named phases.
- GPU runtime — individual kernel launches, streams, durations.
ARGUS instruments each layer with a different tool, not one mega-profiler:
| Signal | Mechanism | Overhead (paper) | Our demo |
|---|---|---|---|
| CPU call stacks | py-spy external sampling, streaming snapshots | negligible | not yet (host-side; deferred) |
| Framework semantics | CUDA Events at phase boundaries; correct NCCL stream selection | negligible | yes — argus_overhead_modal.py / CUPTI combo |
| Kernel activity | CUPTI Activity API via libcupti_injector.so + env injection | ~1–2% | yes — real CUPTI Activity API in argus_cupti_modal.py |
Semantics detail worth remembering: communication phases must record events on the actual NCCL stream, not the default compute stream. Putting events on the wrong stream makes AllReduce look instant while the GPU was still busy elsewhere.
CUPTI detail: three decoupled paths — control, lightweight callback enqueue, async parse/export — plus selective injection (skip launcher/compile workers), pre-allocated buffer pools, and bounded queues with backpressure. Our Modal demo compiles a small libargus_cupti_tracer.so, enables CUPTI_ACTIVITY_KIND_CONCURRENT_KERNEL, and streams (name, streamId, duration) into the same KDE/W₁ pipeline. It is not their production injector (no CUDA_INJECTION64_PATH, no async Processor, no selective process filter) — so expect higher overhead than the paper’s <2%.
Data pipeline (§5)
Raw traces fan out through Vector:
- Metrics path → Prometheus remote write → Grafana dashboards + alerts.
- Trace path → per-host Processor (Go) → Perfetto files to object storage + compressed kernel summaries to the metrics store.
Per rank per training step (Table 4):
| Stage | Volume |
|---|---|
| Raw collection | ~10.6 MB |
| Perfetto on disk | ~443 KB |
| Metrics upload | ~18.7 KB (kernels alone: 10 MB → 2.7 KB after KDE) |
At 10k GPUs × ~15 steps/min, online upload is ~2.7 GB/min — large but tractable for a TSDB. nsys / torch.profiler at the same scale would be hundreds of GB per step.
Progressive diagnosis (§6)
Five levels, three automated:
| Level | Input | Output | Latency |
|---|---|---|---|
| L1 | Per-rank iteration time | Anomaly windows (jitter / regression) | seconds |
| L2 | Semantic phase durations | Straggler rank + bottleneck phase | seconds |
| L3 | Compressed kernel stats | Which kernel diverged | minutes |
| L4 | Perfetto trace | Timeline / critical path (manual) | on demand |
| L5 | CPU stacks | Host-side stall (manual) | on demand |
L1 combines sliding-window spike detection with change-point search for step regressions.
L2 is parallelism-aware: compare ranks only within the correct DP/TP/PP/EP group. High CV on self_attention implicates compute; high CV on dp-allreduce may be waiting on a slow peer.
L3 is the paper’s algorithmic centerpiece — see below.
Kernel Compression and Straggler Detection
This is the piece that makes 10k-rank online kernel comparison possible.
Step 1: KDE valley clustering (§5.2)
Within each time window, group events by (kernel, stream, rank). Durations are multimodal: same kernel name at different positions or streams can differ by orders of magnitude (e.g. small vs large AllGather).
ARGUS:
- Log-transform durations.
- Estimate KDE with Scott’s bandwidth rule.
- Split at density valleys (local minima), with filters for minimum samples per side and minimum log-gap between boundaries.
- Emit per-cluster
(count, p50, p99).
Lossy, but preserves what L3 needs: typical time, tail latency, and frequency.
Step 2: Cross-rank comparison via Wasserstein distance (§6.2)
For each (kernel, stream):
- Reconstruct a mixture CDF from compressed stats (log-normal components weighted by
count). - Compute W₁ (Earth Mover’s Distance) between every rank pair.
- Score each rank by mean W₁ to all others; flag outliers with IQR fences (robust to existing stragglers).
Why W₁ over KS or KL? Metric properties, sensitivity to both shift and tail inflation, and stability when supports differ slightly — all matter for fail-slow, which often shows up as tail growth before median moves.
Evaluation Highlights (§8)
On HunYuan-V3 Preview MoE training (8× and 32× GPU nodes), the paper reports:
- ARGUS all-on: < 2% iteration-time overhead, flat RSS (streaming, no trace pile-up).
torch.profileralways-on: 20–44% slowdown, RSS grows until OOM.- nsys always-on: training breaks (NaN at iter 10 on 8 GPU; hang on 32 GPU AllToAll).
The comparison is intentionally harsh — always-on nsys/profiler is not their intended mode — but that is exactly the production gap ARGUS fills.
Our remasurement on Modal A10G
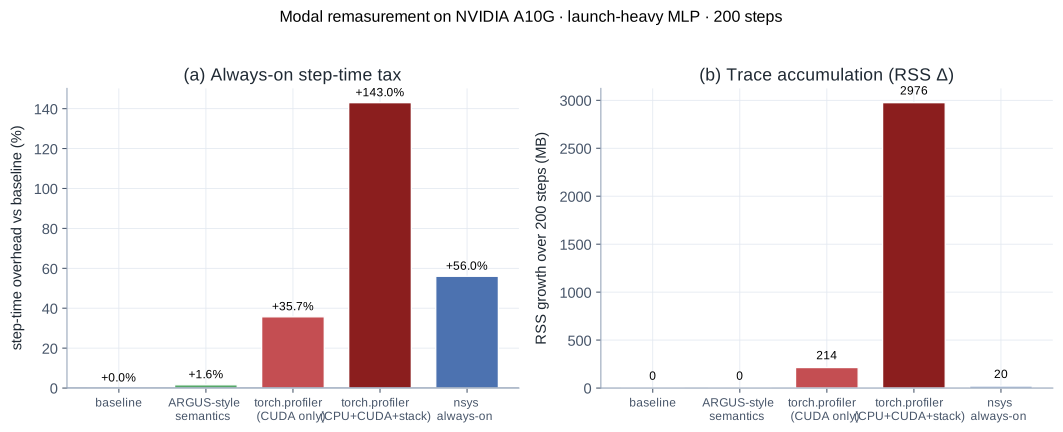
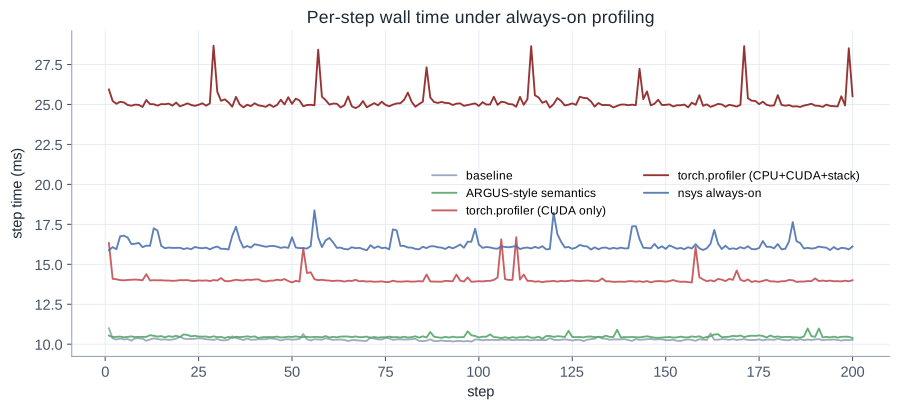
Paper numbers are on HunYuan MoE multi-GPU jobs. To check whether the always-on tax is real on a workload we can reproduce, we ran a launch-heavy eager MLP (48× Linear(512) + GELU, BF16, 200 steps) under five configs on Modal A10G:
Code: playground/argus_overhead_modal.py
| |
| Config | Median step | Overhead | RSS Δ (200 steps) |
|---|---|---|---|
| baseline | 10.29 ms | — | ~0 MB |
| ARGUS-style semantics (CUDA Events on fwd/bwd/opt) | 10.46 ms | +1.6% | ~0 MB |
torch.profiler CUDA only | 13.96 ms | +35.7% | +214 MB |
torch.profiler CPU+CUDA+shapes+stacks | 25.00 ms | +143% | +2.98 GB |
nsys profile always-on (cuda,nvtx,osrt) | 16.05 ms | +56.0% | +20 MB (+21 MB .nsys-rep) |
Raw results: argus_overhead_results.json
What this remasurement supports:
- Semantics-only always-on is cheap (~1.6%), in the same ballpark as ARGUS’s claimed phase instrumentation cost.
torch.profileris not always-on-safe once you ask for useful fidelity — CUDA-only already costs ~36% here and grows RSS; full CPU+stack mode more than doubles step time and piles up ~3 GB in 200 steps.nsysalways-on is also expensive (~56% step-time tax on this single-GPU loop). We did not reproduce the paper’s multi-GPU hang/NaN — that failure mode is about distributed NCCL/AllToAll under nsys, which this microbench does not exercise.
CUPTI Activity API remasurement (the missing third channel)
Earlier demos timed ops with CUDA Events. That is fine for semantics, but it is not ARGUS §4.3. We now compile and run a real CUPTI Activity collector on Modal:
| |
Sources: playground/argus_cupti_tracer.cpp · playground/argus_cupti_modal.py
What it does:
- Build
libargus_cupti_tracer.soagainst the image’s CUPTI (CUpti_ActivityKernel9on CUDA 12.4). cuptiActivityRegisterCallbacks+cuptiActivityEnable(CONCURRENT_KERNEL).- Run a launch-heavy MLP; flush; read
(name, streamId, duration_ms)records. - Feed those records into the same KDE compression + W₁ L3 detector (simulate 8 ranks, slow rank 5’s
gemmfamily).
Modal A10 results (argus_cupti_results.json):
| Metric | Value |
|---|---|
| CUPTI records / 80-step window | 12,800 |
| Top kernel | ampere_bf16_s16816gemm_… (720 hits) |
| CUPTI always-on overhead | +10.9% step time |
| CUPTI + semantics | +13.3% |
| L3 from real CUPTI names | flagged [5], compression ~273× |
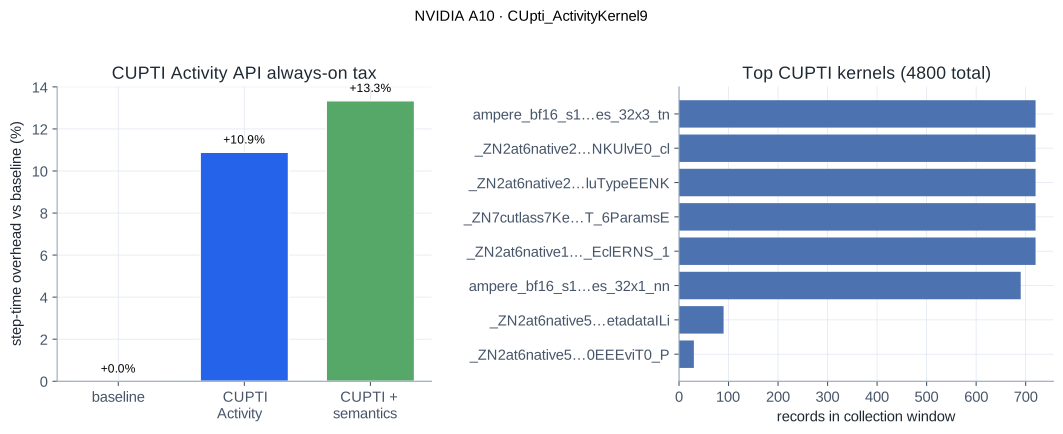
Why our CUPTI tax (~11%) is higher than ARGUS’s claimed ~1–2%: we keep records in-process, flush synchronously, and skip their pre-allocated buffer pool / async Processor / selective injection / backpressure path. The point of this demo is API fidelity (real Activity records → compress → detect), not matching production overhead engineering.
Case Studies — What Actually Breaks at Scale
These five stories are more valuable than the microbenchmarks. We remasured Cases 1–4 at small scale; each subsection has a Reproduce recipe you can run on Modal.
| Paper case | Failure mode | Small-scale? | Our demo |
|---|---|---|---|
| 1 Compute straggler | Local GPU compute slow | Yes | L1 change-point + L2 CV |
| 2 Silent link degradation | Comm kernels slow, step time flat | Yes (synthetic NCCL timings) | L1 silent, L3 W₁ blocks |
| 3 PP bubble masking | Slow PP stage aligned by grad_sync | Yes (4-stage toy PP) | Totals silent, bwd catches |
| 4 FlashAttention JIT | Intermittent host compile stall | Yes (host sleep on A10G) | L1 jitter, GPU flat |
| 5 Misleading network alert | Compute straggler → late collective | Partial | Skipped; composable from 1+2 |
All four demos live in playground/argus_cases_modal.py. Run everything, or one case at a time:
| |
Committed results: argus_cases_results.json.
Case 1: Compute Straggler Localization
Paper (4096-GPU VLM): L1 regression + L2 CV on compute-only phases isolated DP replicas 656–657 with 150× slower compute kernels.
Reproduce
- Fault injection (
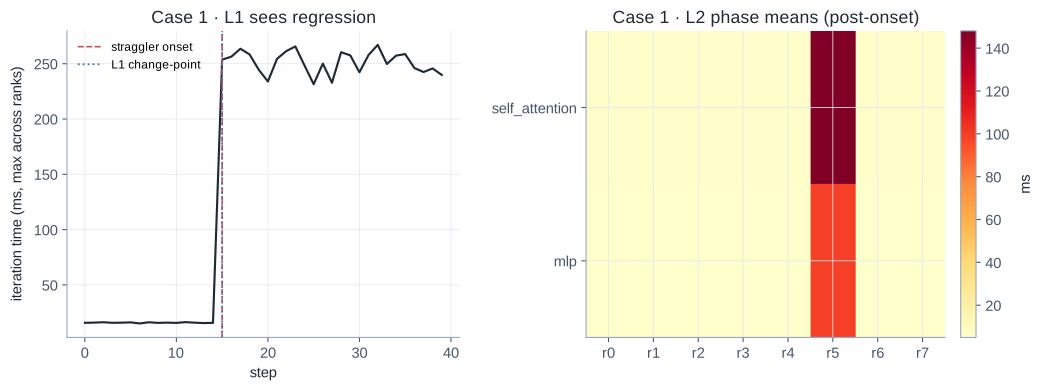
case1_compute_straggler): 8 DP ranks × 40 steps; from step 15, rank 5’sself_attention/mlpare scaled ×25 / ×20 (local compute only). - Detection: L1 change-point on job iteration time (
maxacross ranks); L2 CV + z-score on post-onset phase means. - Run:
| |
- Expect stdout like
Case1 L1=True L2=True flagged=[5], and JSON fieldsl1_change_point.t ≈ 15,l2.flagged_ranks == [5].
Our remasurement: iteration time jumps ~16× at onset; L1 change-point at t=15; L2 flags only rank 5.
Case 2: Communication Link Degradation
Paper (512-GPU audio): iteration time stable so L1/L2 silent; L3 W₁ revealed one EDP group with PCIe faults.
Reproduce
- Fault injection (
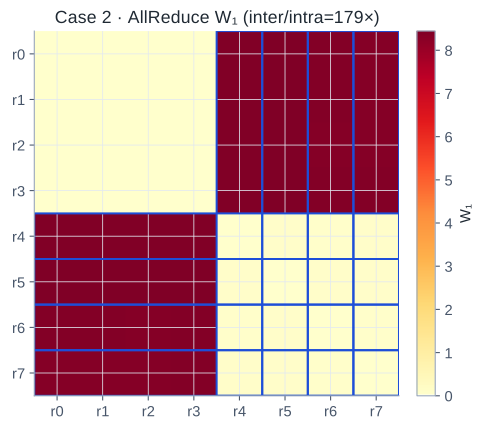
case2_link_degradation): ranks{4,5,6,7}get slower syntheticAllReduce/AllGather/ReduceScatterdurations (×8 / ×12 / ×20); iteration time is a flat elevated series (steady degraded regime). - Detection: confirm L1 is silent; build per-kernel W₁ matrices + primary-cluster p50; flag ranks whose p50 ≥ 3× the healthy-half median. (Plain IQR-on-mean-W₁ fails when half the ranks are slow — groups are symmetric.)
- Run:
| |
- Expect
Case2 L1_silent=True L3=True flagged=[4, 5, 6, 7] W1 inter/intra≈179x.
Our remasurement: L1 silent; AllReduce W₁ inter/intra ≈ 179×; p50 gating recovers the degraded EDP group.
Case 3: Pipeline Bubble Amplification
Paper (PP=4): last stage ~1.9× slower backward-compute, but finish_grad_sync aligns totals so L1–L3 stay quiet.
Reproduce
- Fault injection (
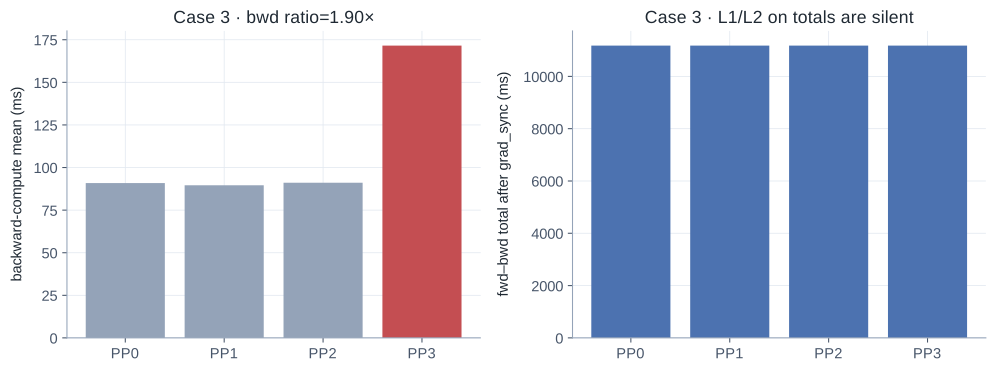
case3_pp_bubble_masking): 4 PP stages; stage 3 backward-compute ×1.9; upstream stages get larger bubbles (idle wait);finish_grad_syncforces identical fwd–bwd totals across stages. - Detection: L1/L2 on aligned totals should be silent (CV ≈ 0); inspect backward-compute means / peer-median ratio (≥1.5×) to recover stage 3.
- Run:
| |
- Expect
Case3 totals_silent=True bwd_detected=True ratio≈1.90.
Our remasurement: totals CV = 0; bwd ratio 1.90× catches stage 3. Upstream bubbles larger; straggler bubbles tighter (compute-packed).
Case 4: FlashAttention JIT Compilation
Paper: occasional 40× backward spikes from CuTe DSL JIT; L1 catches jitter; L2/L3 dilute rare events.
Reproduce
- Fault injection (
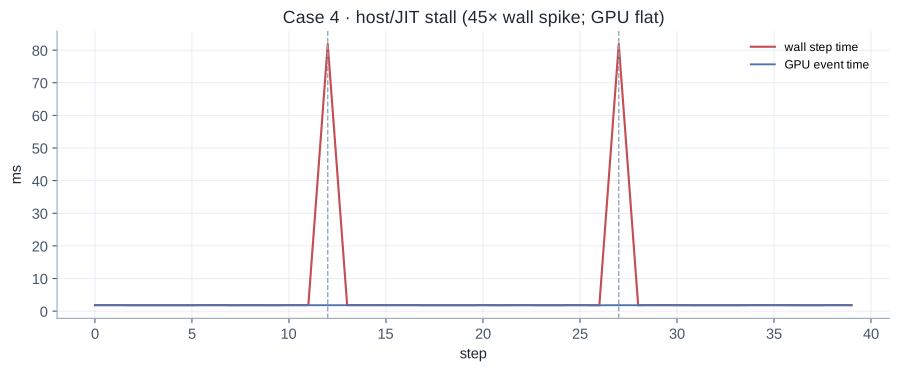
case4_jit_stall_gpu): real A10G training step; on steps{12, 27}insert an 80 ms hostsleepbefore the step (FlashAttention CuTe JIT stand-in). Record wall time vs CUDA-event GPU time. - Detection: L1 sliding-window max/min ratio (≥2×) should fire; GPU time stays flat (host-bound); a window-mean L2/L3 view dilutes two rare spikes.
- Run:
| |
- Expect
Case4 L1=True spike_ratio≈45x stall_steps=[12, 27], withgpu_median_ms ≈ normal walland spike walls ≈ 80 ms + step.
Our remasurement: wall spike ~45×; GPU event time ~1.8 ms throughout; L1 jitter fires.
Case 5: Compute Straggler with Misleading Out-of-band Metrics
Paper (12,960-GPU MoE): out-of-band “port down” looked like network; ARGUS showed pure-compute mlp degradation, with shorter ReduceScatter from late collective entry.
Reproduce (manual composition, no dedicated flag yet)
- Take Case 1’s slow-compute ranks.
- Measure collective duration as
finish − max(arrive_i)among participants: stragglers arrive late → the measured ReduceScatter window looks shorter for that EP group (secondary symptom), while compute-only phases stay long. - Contrast with an out-of-band “link down” story: if only compute phases regress, remediation is node replace, not NIC repair.
We did not wire a full EP=32 schedule on one Modal GPU — the detection insight is already covered by Cases 1+2.
Meta-lesson: no single diagnostic level wins. ARGUS wins by composition.
Mini Experiment: KDE + W₁ on a Simulated Straggler
Two paths into the same statistical core:
- CUDA Event timings (
argus_demo_modal.py) — quick, no CUPTI link needed. - Real CUPTI Activity records (
argus_cupti_modal.py) — the ARGUS §4.3 channel; see above.
Both compress with KDE and run L3 W₁ detection.
Code: playground/argus_demo_modal.py
The demo:
- Collects repeated CUDA Event timings for a tiny MLP-like loop on Modal (
gemm_fc1,gelu,gemm_fc2,layernorm). - Simulates 8 DP ranks, injecting a 2.8× slowdown on GEMM kernels for rank 5.
- Runs KDE clustering +
(count, p50, p99)compression. - Runs L3-style W₁ + IQR detection on
gemm_fc1(with a relative-elevation gate so tiny timing jitter on healthy ranks does not false-positive at N=8).
Results below are from a Modal A10G run (argus_demo_results.json):
| Metric | Value |
|---|---|
| Device | NVIDIA A10G (Modal) |
| Events per rank | 480 |
| Mean compression ratio | ~58× (demo scale; paper reports ~3,700× at full CUPTI volume) |
| True straggler rank | 5 |
| L3 flagged ranks | [5] |
| Rank 5 mean W₁ deviation score | 2.32 vs ~0.36 for healthy ranks |
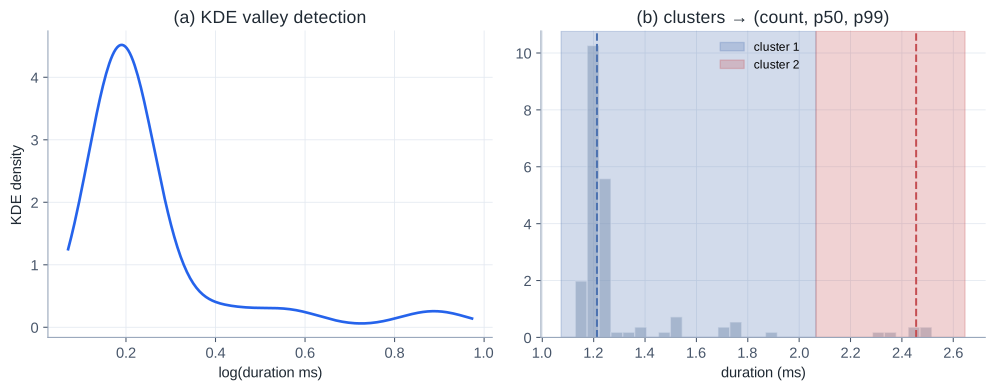
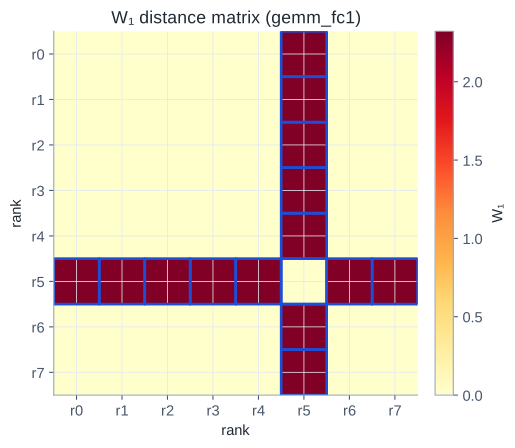
Figures regenerate with:
Caveats: the KDE/W₁ demo validates the detection math, not ARGUS end-to-end overhead — see the Modal remasurement above for profiler taxes. Real traces are noisier, multimodal clustering is load-bearing, and parallelism-group routing in L2 is doing real work the toy script skips.
Comparison With Tools You May Already Use
| Tool / system | Always-on? | Kernel-level cross-rank? | Typical overhead |
|---|---|---|---|
| Grafana / DCGM-style metrics | yes | no | very low |
| Cluster fail-slow monitors (Greyhound, Holmes, C4, …) | yes | no (machine / link / phase) | low |
| Training-job tracers (MegaScale, EROICA, …) | triggered / partial | partial | medium–high when deep |
nsys / torch.profiler | manual / short windows | yes (single job) | our A10G: nsys ~56%, profiler CUDA ~36% / full ~143% |
| ARGUS | yes | yes (via compressed stats) | paper < 2%; our semantics ~1.6%, naive CUPTI Activity ~11% |
For a single-machine workflow, stay with the end-to-end profiling post. ARGUS is the answer when every minute of a month-long 10k-GPU run needs a watchdog that can still name the kernel.
Discussion and Open Directions
The authors note two forward paths:
- LLM agents on top of L1–L3 outputs + topology context — early reports of tens of minutes → minutes for triage.
- Generalization beyond pre-training (already used on RL; inference serving planned).
What the paper does not fully open-source (as of this writing) is the injector, Processor, and diagnosis service — so practitioners will treat this as an architectural reference rather than a drop-in library.
Takeaways
- Decompose before monolith profilers. Match the tool to the layer: py-spy for host, CUDA Events for semantics, CUPTI for kernels.
- Compression is part of observability design, not a post-processing afterthought — KDE + sufficient statistics enables online 10k-rank comparison.
- Diagnose in stages with parallel automated levels; reserve Perfetto and CPU stacks for the last mile.
- Fail-slow has many faces — silent link decay, PP bubble transfer, JIT spikes, and compute stragglers faking network symptoms all need different levels to surface.
- Always-on changes the question from “can we profile this job?” to “can we afford not to?”
References
- Zhou et al., ARGUS (arXiv:2606.20374)
- Wu et al., Greyhound — fail-slow hunting via iteration-time / hybrid-parallel signals (USENIX ATC 2025)
- Yao et al., Holmes — localizing training irregularities on mega-scale GPU clusters (NSDI 2025)
- Dong et al., C4 — real-time anomaly detection and communication optimization for large-scale training (HPCA 2025)
- Deng et al., Minder — faulty-machine detection for distributed training (NSDI 2025)
- Jiang et al., MegaScale — LLM training production stack at 10k+ GPUs, with phase-level tracing (NSDI 2024)
- Guan et al., EROICA — online performance troubleshooting; deep kernel profiling on trigger (NSDI 2026)
- Cui et al., FLARE — anomaly diagnostics for divergent LLM training at thousand-GPU scale (NSDI 2026)
- Related local writeup: Profiling a PyTorch Training Job End to End